
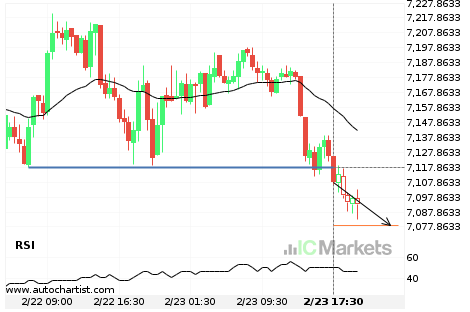
Australia 200 Index – psychological price line breached
Australia 200 Index has broken through a support line. Because we have seen it retrace from this price in the past, one should wait for confirmation of the breakout before trading. It has touched this line numerous times in the last 2 days and suggests a possible target level to be around 7078.9038 within the […]

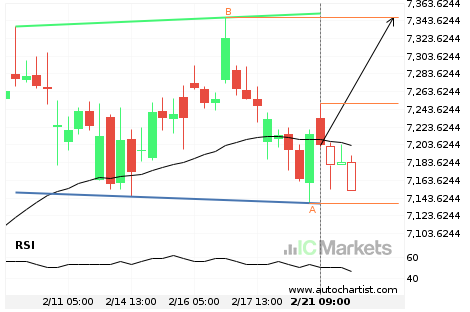
Will Australia 200 Index have enough momentum to break resistance?
Australia 200 Index is heading towards the resistance line of a Triângulo and could reach this point within the next 11 hours. It has tested this line numerous times in the past, and this time could be no different from the past, ending in a rebound instead of a breakout. If the breakout doesn’t happen, […]
Australia 200 Index approaching resistance of a Bandeira
Australia 200 Index is approaching the resistance line of a Bandeira. It has touched this line numerous times in the last 12 days. If it tests this line again, it should do so in the next 2 days.
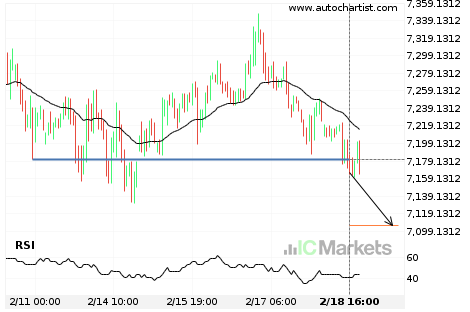
Important price line breached by Australia 200 Index
Australia 200 Index has broken through 7180.8901 which it has tested numerous times in the past. We have seen it retrace from this price in the past. If this new trend persists, Australia 200 Index may be heading towards 7105.8452 within the next 2 days.
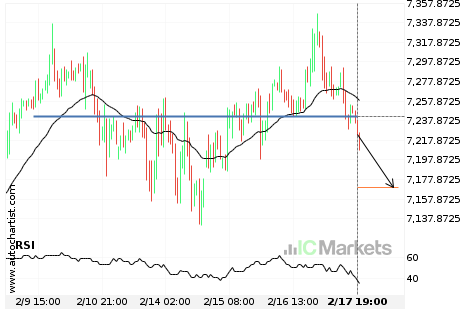
Australia 200 Index – psychological price line breached
Australia 200 Index has broken through a support line. Because we have seen it retrace from this price in the past, one should wait for confirmation of the breakout before trading. It has touched this line numerous times in the last 9 days and suggests a possible target level to be around 7170.1328 within the […]
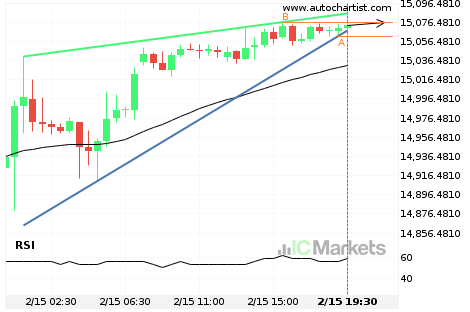
Will FTSE China A50 Index have enough momentum to break resistance?
FTSE China A50 Index is heading towards the resistance line of a Cunha ascendente and could reach this point within the next 5 hours. It has tested this line numerous times in the past, and this time could be no different from the past, ending in a rebound instead of a breakout. If the breakout […]
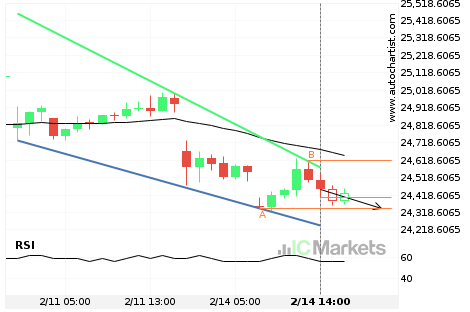
Hong Kong 50 Index approaching support of a Cunha descendente
Hong Kong 50 Index is approaching the support line of a Cunha descendente. It has touched this line numerous times in the last 4 days. If it tests this line again, it should do so in the next 6 hours.
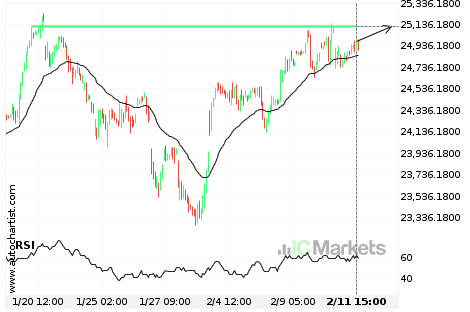
Breach of important price line imminent by Hong Kong 50 Index
Hong Kong 50 Index is moving towards a line of 25112.9004 which it has tested numerous times in the past. We have seen it retrace from this position in the past, so at this stage it isn’t clear whether it will breach this price or rebound as it did before. If Hong Kong 50 Index […]
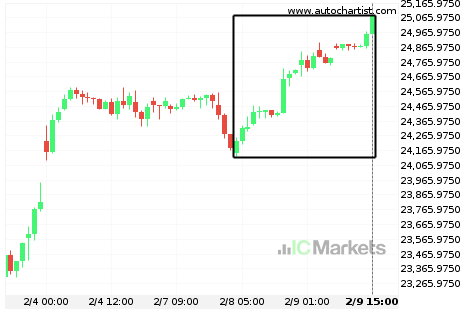
What’s going on with Hong Kong 50 Index?
Those of you that are trend followers are probably eagerly watching Hong Kong 50 Index to see if its latest 3,5% move continues. If not, the mean-reversion people out there will be delighted with this exceptionally large 2 days move.
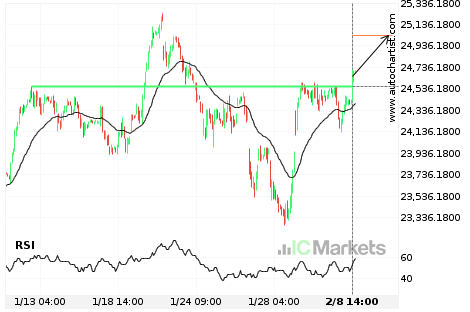
Important price line breached by Hong Kong 50 Index
Hong Kong 50 Index has broken through 24561.4004 which it has tested numerous times in the past. We have seen it retrace from this price in the past. If this new trend persists, Hong Kong 50 Index may be heading towards 25035.1191 within the next 3 days.